
Page 70 - Demo
P. 70
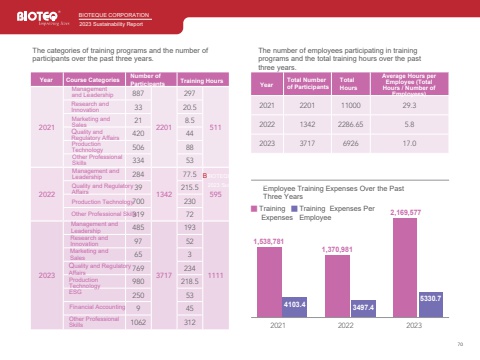
70The categories of training programs and the number of participants over the past three years.Year Course Categories Number of Participants Training Hours2021Management and Leadership 8872201297511Research andInnovation 33 20.5Marketing andSales 21 8.5Quality and Regulatory Affairs 420 44Production Technology 506 88Other Professional Skills 334 532022Management and Leadership 284134277.5595Quality and Regulatory Affairs 39 215.5Production Technology700 230Other Professional Skills319 722023Management and Leadership 48537171931111Research and Innovation 97 52Marketing and Sales 65 3Quality and Regulatory Affairs 769 234Production Technology.980 218.5ESG 250 53Financial Accounting 9 45Other Professional Skills 1062 312The number of employees participating in training programs and the total training hours over the past three years.YearTotal Number of ParticipantsTotalHoursAverage Hours per Employee (Total Hours / Number of Employees)2021 2201 11000 29.3 2022 1342 2286.65 5.8 2023 3717 6926 17.0 %u2588 Training %u2588 Training Expenses Per Expenses Employee2021 2022 2023 1,538,7811,370,9814103.4 3497.45330.7 2,169,577Employee Training Expenses Over the Past Three YearsBBIOTEQUE CORPORATION 2023 Sustainability ReportBBIOTEQUE CORPORATION2023 Sustainability Report
